
I’ve been gathering data on myself for over 18 years, writing down all the books I read as I finish them since 1996. As a self-quantification project, I categorized the books by genre and displayed the data in a polar area chart. The area of each segment in the chart is equal to all the others even though their shapes differ, and each of these segments is equal to one book. I’ve highlighted a few of my favorite books and most read authors.
I made this chart before I had learned how to use more sophisticated visualization tools, such as R. To create it, I used good old fashioned math and Adobe Illustrator. This was probably not the most efficient way to make such a chart, but I ended up with something that doesn’t look like the standard output of any particular graphing program, because it’s not.
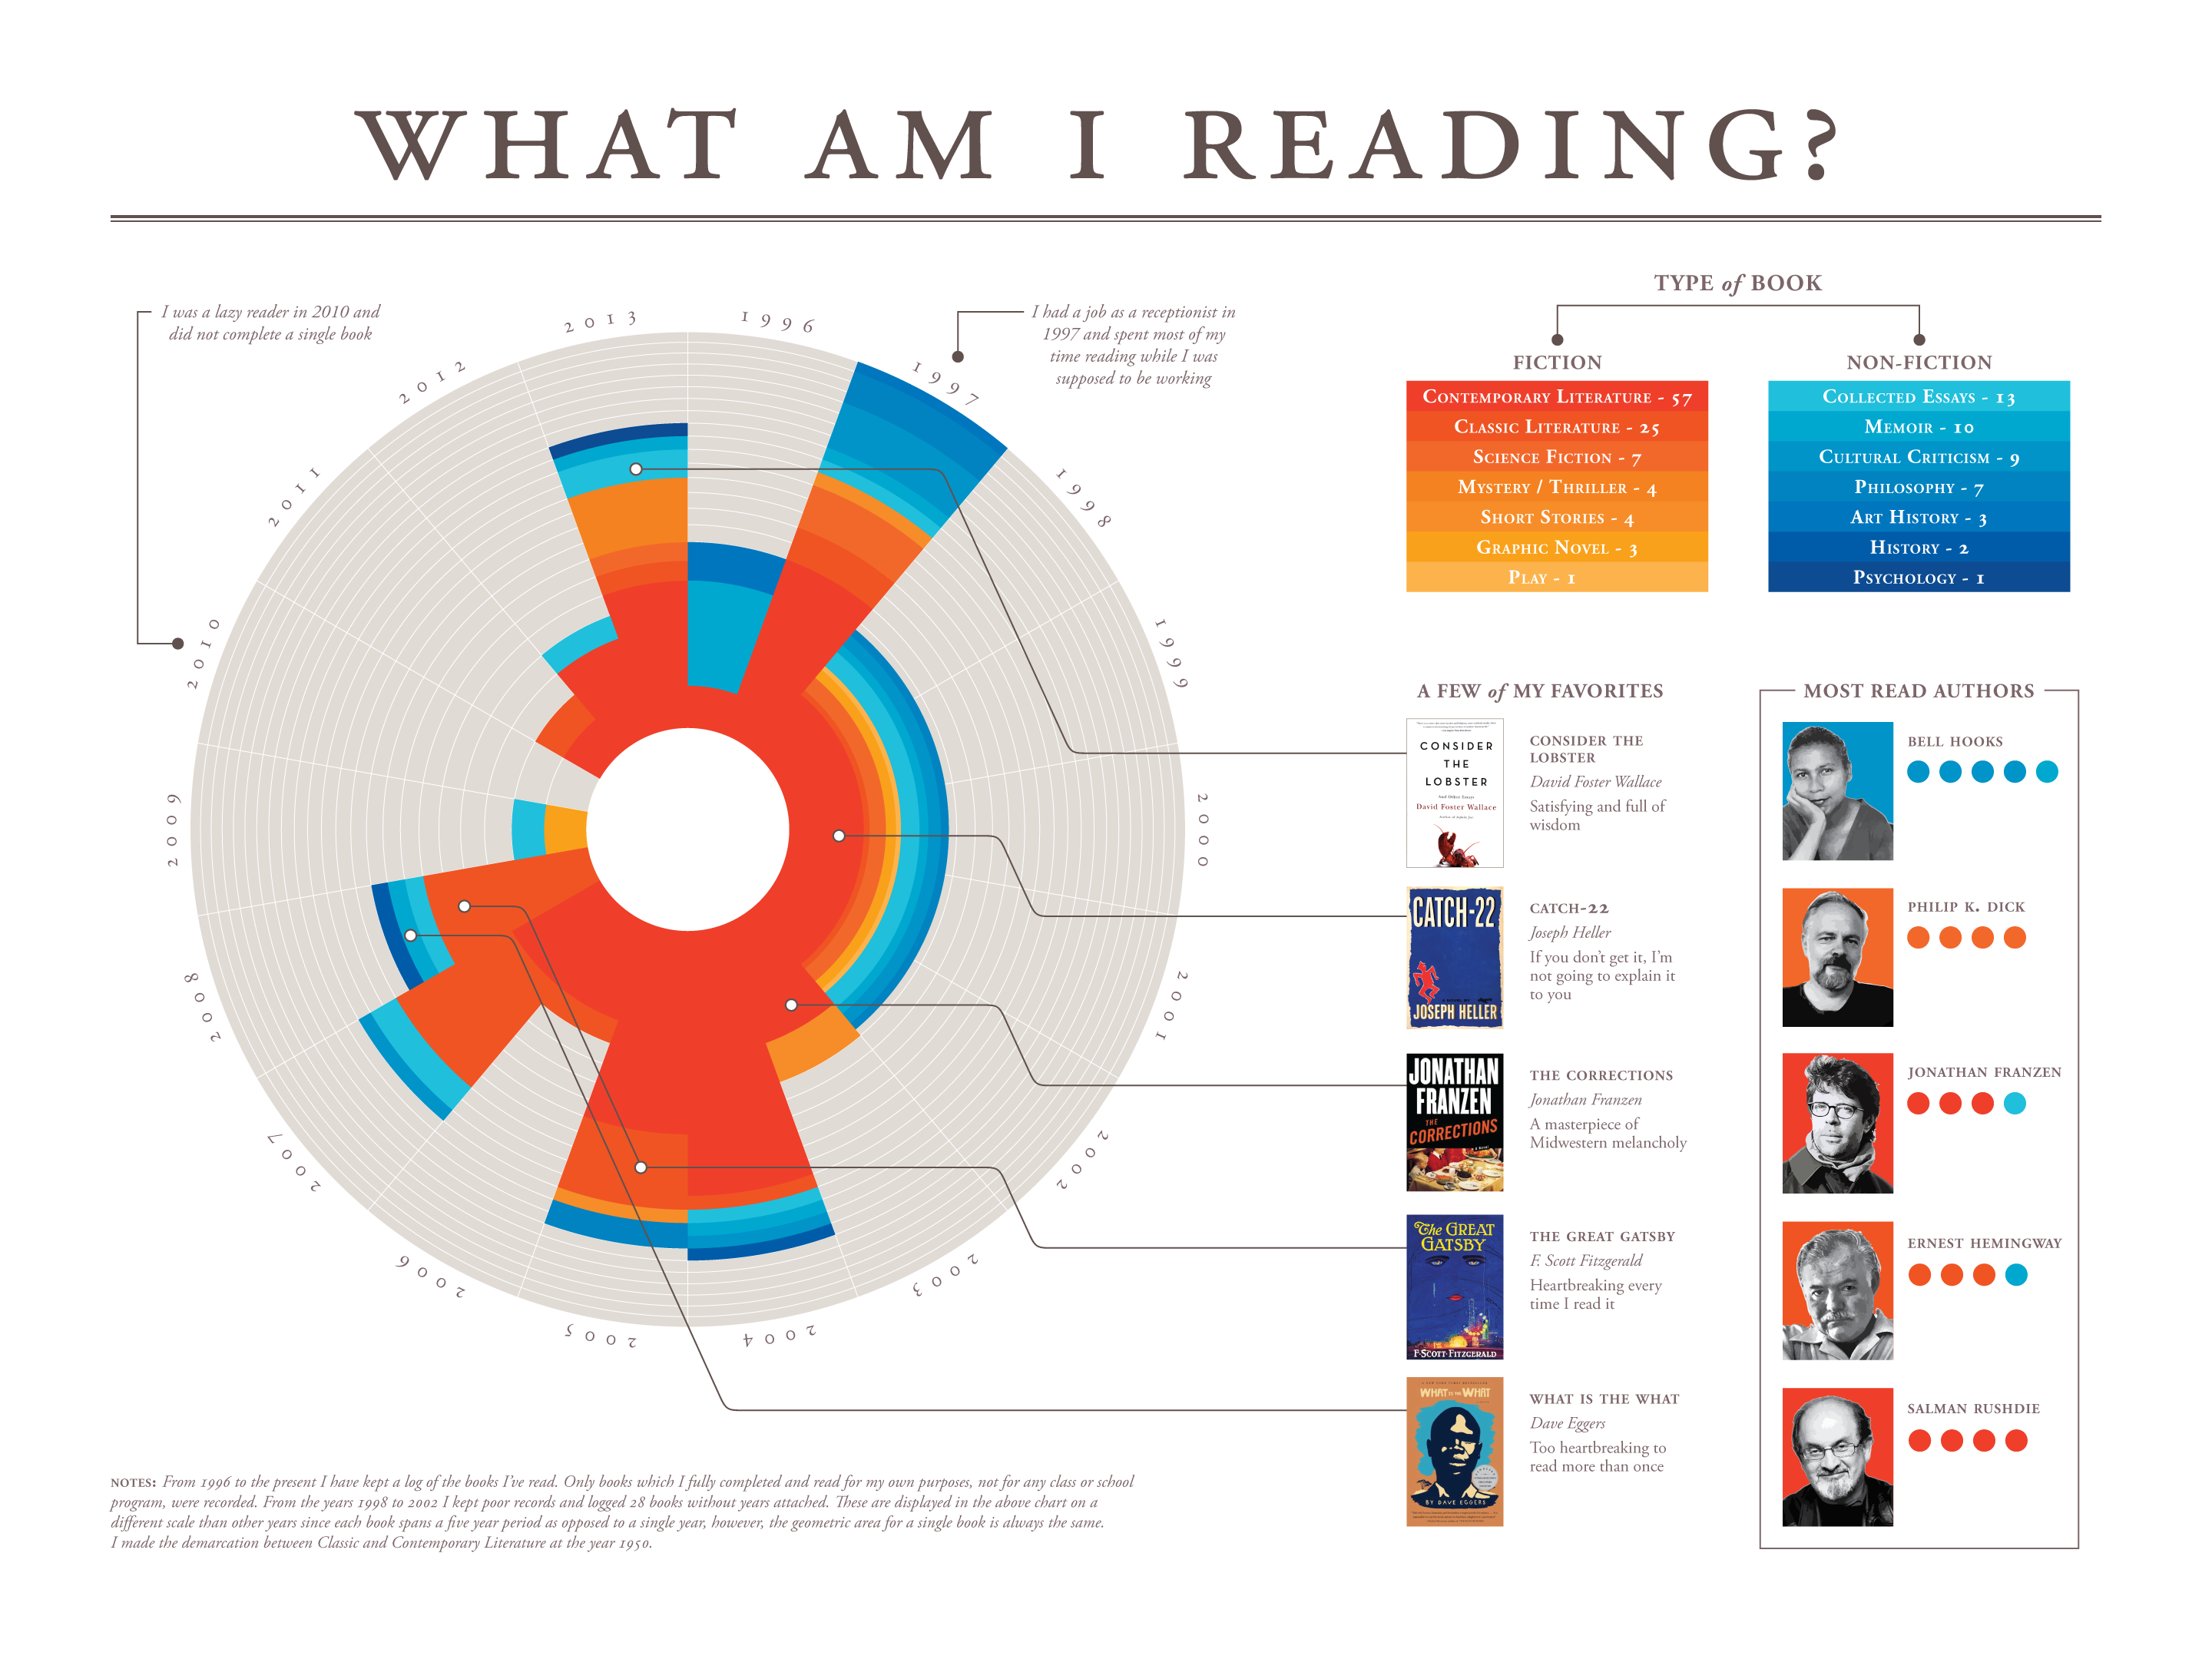

Note: I kept poor records from 1998 to 2002, recording 28 books without years attached. These are displayed on a slightly different scale than other years, since each book spans a five year period. However, the geometric area for a single book is always the same. I only keep records of books read for my own pleasure, any books read for a class or school program are not included.
